Using CSS with Live Data
Live Data requests information from a server and displays the resulting hotspot content as HTML. How you create and style the HTML when using Live Data is the topic of this page.
A web service will generally provide hotspot content in one of the following forms:
- HTML tags with inline styling
- HTML tags with class names, but no inline styling
- No HTML at all, only data
HTML with Inline Styling
When a web service response contains HTML with inline styling, no CSS is needed because the HTML is ready to display.
Example: <div style="color:blue;font-weight:bold;">Smith</div>.
HTML with Class Names
When the web service response contains HTML tags with class names, but no inline styling, CSS is needed to specify the styling of the class names.
Example: <div class="last-name">Smith</div>.
The Sample Population Map shows an example of this approach.
No HTML
When a web service response contains only data, JavaScript is required to convert the data into HTML with either inline styling or class names. The sections that follow show JavaScript that creates the HTML and CSS that styles it. The example uses these files:
| Resource | URL | Description |
|---|---|---|
| Tour | https://mapsalive.com/samples/83772 | USA map with a hotspot for each state capital. If you click the link to run the tour by itself, nothing will happen when you select a hotspot because the tour contains no JavaScript to make a Live Data request. |
| HTML | https://livedata.mapsalive.com/samples/states/states.htm | A web page containing the tour, JavaScript, and CSS. If you click the link, the tour will display information about a state when you select a hotspot. |
| JavaScript | https://livedata.mapsalive.com/samples/states/states.js | Converts the web service response into HTML |
| CSS | https://livedata.mapsalive.com/samples/states/states.css | Styles the HTML |
| Web service | https://livedata.mapsalive.com/php/population/service.php | Provides data for all 50 states. Click the link to see the data in your browser. |
Note that the web service in this example, and the JavaScript file that will invoke it, are both on the same domain livedata.mapsalive.com. If the domains were different, the web-service, for security purposes, must allow a cross-origin request as explained in the server communication section. When both the web service and JavaScript are on the same domain, the request is same-origin which has no security restrictions.
HTML
The contents of the states.htm file are shown below. They were copy/pasted from the tour's code snippets and then edited as follows:
- A
<script>tag for thestates.jsfile was inserted after the<script>tag for the tour. - A
<link>tag for thestates.cssfile was inserted after thestates.js<script>tag.
The actual position of the additional <script> and <link> tags is not too important except that the <link> tag must be below the tour's <script> tag if the states.css needs to override any styling within the tour itself.
<!DOCTYPE html>
<html lang="en">
<head>
    <meta http-equiv="Content-Type" content="text/html;charset=utf-8" />
    <meta name="viewport" content="width=device-width, initial-scale=1.0">
</head>
<body>
    <script type="module" id="ma-83772" src="https://mapsalive.com/samples/83772/mapsalive-module.js"></script>
    <script type="text/javascript" src="https://livedata.mapsalive.com/samples/states/states.js"></script>
    <link rel="stylesheet" type="text/css" href="https://livedata.mapsalive.com/samples/states/states.css">
    <div class="ma-83772" data-flex-height="500"></div>
</body>
</html>
When your run the HTML file in a browser, the tour loads and calls the onEventPageLoading method in the JavaScript shown below.
JavaScript
While the map loads, the JavaScript makes a Live Data request to get the data for all 50 states. When the server responds, the JavaScript converts the data for each state into HTML and assigns it to the state's hotspot.
function onEventPageLoading(event) {
    // Request information about all 50 states from the server.
    let url = `https://livedata.mapsalive.com/php/population/service.php`;
    event.api.liveData.requestData("json", "", url);
}

function onEventLiveDataResponse(event) {
    // This function gets called once for each state and so the response is for one state.
    let response = event.response;

    // Check if there was a server error.
    if (response.error) {
        alert(`Error: ${response.data}`);
            return;
    }

    // Get the JSON object for the state and create the HTML from it.
    let state = response.data;
    let html = createHtmlForState(state);

    // Set the hotspot's title and HTML.
    event.api.setHotspotTitle(response.id, state.name);
    event.api.setHotspotHtml(response.id, html);
}

function createHtmlForState(state) {

    // Convert the population value to use commas e.g. change 12345 to 12,345.
    let nf = new Intl.NumberFormat('en-US');
    let population = nf.format(state.population);

    // Insert the state's data properties into <div> tags with class names.
    let html = `
        <div class='facts'>
            <div class='fact-row'>
                <div class='fact-name'>Population:</div>
                <div class='fact-value'>${population}</div>
            </div>
            <div class='fact-row'>
                <div class='fact-name'>Capital:</div>
                <div class='fact-value'>${state.capital}</div>
            </div>
            <div class='fact-row'>
                <div class='fact-name'>Largest City:</div>
                <div class='fact-value'>${state.city}</div>
            </div>
        </div>
        <div class='flag'><img src='${state.flag}'></div>
        `;

    return html;
}
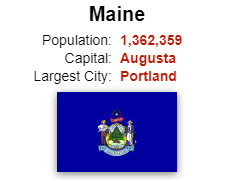
CSS
The CSS uses CSS Grid and CSS Flexbox to format facts about the state into rows that each have two columns as shown below.
.facts {
    grid-area: metadata;
    display: grid;
    grid-template-columns: 100%;
    grid-auto-rows: min-content;
    grid-gap: 2px;
}

.fact-row {
    display: grid;
    grid-template-columns: 90px 1fr;
    grid-gap: 8px;
    grid-template-areas: "namecol valuecol";
    font-size: 14px;
    margin-left: 24px;
}

.fact-name {
    grid-area: namecol;
    text-align: right;
}

.fact-value {
    grid-area: valuecol;
    color: #000;
    font-weight: bold;
    color: #b81904;
}

.flag {
    display: flex;
    flex-direction: column;
    align-items: center;
}

.flag img {
    box-shadow: 0 2px 8px rgb(128 128 128);
    margin: 8px;
    max-width: 100%;
}

.maPopupTitle {
    font-size:20px !important;
    text-align: center !important;
}
The .maPopupTitle style uses !important to override the tour's styling of the popup title. !important is needed because the tour's CSS uses the popup title's element Id ma-1-83772-PopupTitle to style the title and since an Id has higher precedence than a class name, the .maPopupTitle class style without !important would have no effect.
To avoid using !important, the style could have been specified as shown below which uses the element Id to override the tour's styling of that Id.
#ma-1-83772-PopupTitle {
    font-size:20px;
    text-align: center;
}
A cleaner alternative would be to code the title style in the CSS field on the Custom HTML screen and leave the other styles in the states.js file. That way the MapsAlive Tour Builder would automatically convert #maPopupTitle to #ma-1-83772-PopupTitle and the CSS would still work if used in a different tour which would have a different tour number than 83772.
#maPopupTitle {
    font-size:20px;
    text-align: center;
}